Google PageSpeed Insights For SEOs & Developers. PageSpeed Insights (PSI) is a cool free tool from Google. It checks how fast a website works on computers and phones and gives tips to make it faster and better for users.
PageSpeed Insights looks at a website’s code and design, like pictures, fonts, and special effects. Then, it suggests ways to make the website faster. This might mean making pictures smaller, simplifying the code, or using fewer requests for information.
Now, let’s see how you can use PageSpeed Insights:
- First, visit PageSpeed Insights.
- Type in a website’s address (URL) and click “Analyze.”

You can choose to check either the Desktop or Mobile version of your website. Usually, the Mobile score is not as good as the Desktop score. Looking at Mobile data can help you find and fix more problems, so I suggest focusing on that.

In the next part
you’ll see information from real people who visited your website. PageSpeed Insights gets this info from a big collection of data called the Chrome User Experience Report (CrUX). These are stats from folks who use the Google Chrome web browser and agreed to share their data.
At the top, there’s a tab that lets you switch between looking at data for individual pages or for the whole website (like the main web address). Not all pages or websites have this data – it depends on how many people visit your site and say it’s okay to share their data.
As of April 2023, there are around 29.5 million different website sources in the CrUX dataset.

The next part is about something called Core Web Vitals (CWV). It basically checks if your website is doing well or not. There are three main things it looks at:
- Largest Contentful Paint (LCP): This is about how quickly the main stuff on your website shows up.
- First Input Delay (FID): It checks if your website responds fast when someone clicks or types something.
- Cumulative Layout Shift (CLS): This looks at how things move around on your website, and if they do it smoothly.
These Core Web Vitals are important because Google uses them to decide where your website shows up in search results. So, it’s good to pay attention to them!

We use colors to make it easy to understand the numbers. Here’s what the colors mean:
- Green: Good
- Orange: Needs improvement
- Red: Poor
To be considered “good,” 75% of the user experiences should meet certain limits for each metric. These limits are:
- For Largest Contentful Paint (LCP):
- Good is under 2500 milliseconds.
- Needs improvement is between 2500 and 4000 milliseconds.
- Poor is over 4000 milliseconds.
- For First Input Delay (FID):
- Good is under 100 milliseconds.
- Needs improvement is between 100 and 300 milliseconds.
- Poor is over 300 milliseconds.
- For Cumulative Layout Shift (CLS):
- Good is under 0.1.
- Needs improvement is between 0.1 and 0.25.
- Poor is over 0.25.
If you want more details, you can click “Expand view” to see how these numbers are distributed.

There are some more numbers in the CrUX database, but right now, Google doesn’t use them to decide how high a website shows up in search results. These numbers are First Contentful Paint (FCP), Interaction to Next Paint (INP), and Time to First Byte (TTFB).
However, in March 2024, they will start using INP instead of FID as one of the important numbers for Core Web Vitals.

We use colors to help you understand the numbers better. Here’s what the colors mean:
- Green: Good
- Orange: Needs improvement
- Red: Poor
To be considered “good,” 75% of the user experiences should be within certain limits for each metric. These limits are:
- For First Contentful Paint (FCP):
- Good is under 1800 milliseconds.
- Needs improvement is between 1800 and 3000 milliseconds.
- Poor is over 3000 milliseconds.
- For Interaction to Next Paint (INP):
- Good is under 200 milliseconds.
- Needs improvement is between 200 and 500 milliseconds.
- Poor is over 500 milliseconds.
- For Time to First Byte (TTFB):
- Good is under 800 milliseconds.
- Needs improvement is between 800 and 1800 milliseconds.
- Poor is over 1800 milliseconds.
If you want more details, you can click “Expand view” to see how these numbers are spread out.

The final part explains where this information comes from. It’s all based on what real users have experienced while using the website. This data is an average of what happened over the past 28 days.

Lab data. Google PageSpeed Insights For SEOs & Developers.
comes from a tool called Lighthouse. It checks how well a website works and how good it is. Usually, you run Lighthouse in your own web browser, but with PageSpeed Insights, it runs on Google’s computers.
When you look at the results, you’ll see a bunch of numbers for things like Performance, Accessibility, Best Practices, and SEO. These numbers mainly tell you if your website follows good rules, but they don’t give you a detailed score for each area.

We’re using colors to make it easy to see what’s good and what needs improvement.
In this article, we’ll mainly talk about the “Performance” part because that’s what SEOs care about. First, you’ll see a score for how well your website performs, and there’s also a picture of your webpage.

You’ll get a score ranging from 0 to 100, which tells you how well your website is doing. Here are the score ranges:
- Good: 90 to 100
- Needs improvement: 50 to 89
- Poor: 0 to 49
But here’s the thing: even if you have a good score, your website might still load slowly and not meet Core Web Vitals (CWV) standards. That’s because other things like internet speed, how busy the server is, saving data for later use, and the device someone is using can also affect how fast your page loads.
Only 2% of websites get a perfect 100 score, and if you score 50, you’re in the top 25% of websites.
Your score and the numbers can change each time you test your website. This happens because of things like how fast the internet is, how many people are using the website at once, and different choices web browsers make while loading the page. To get a good idea, it’s a good practice to run the test a few times and take an average of the results.
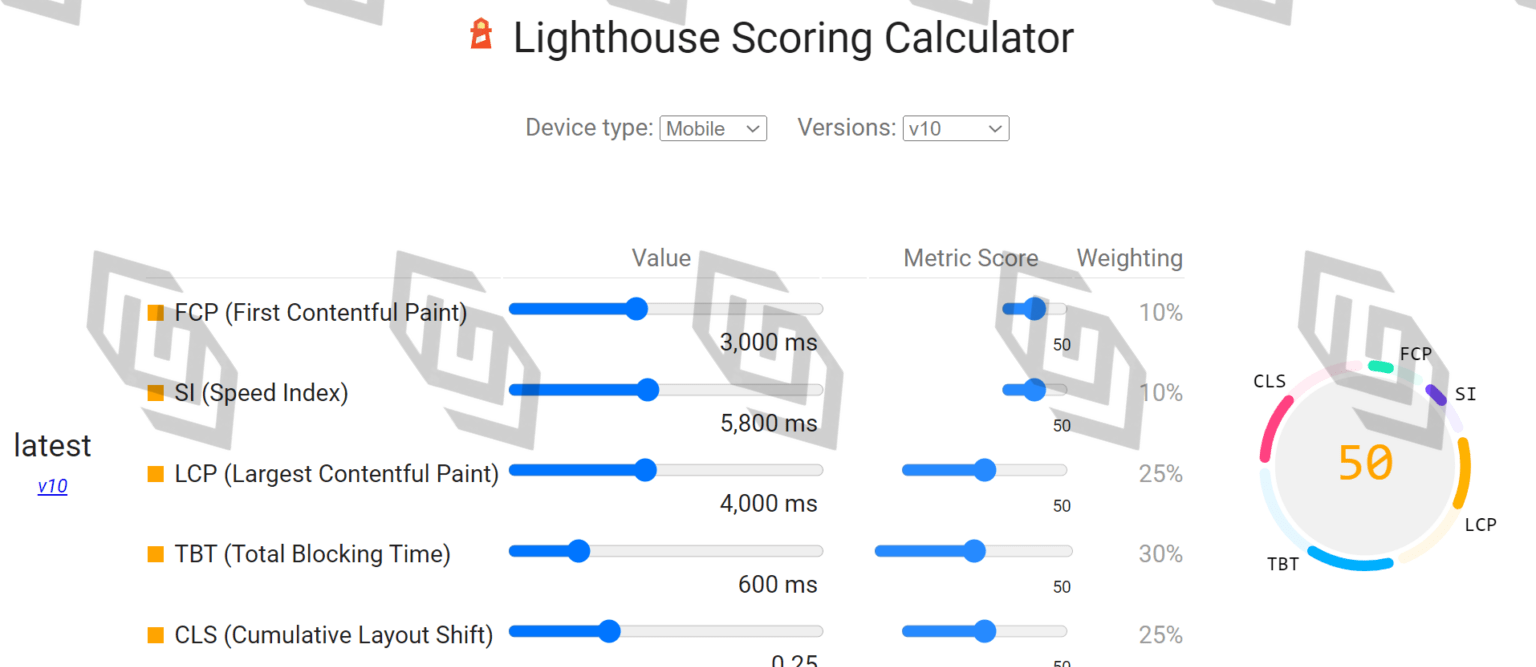
The score is figured out by doing some math with different numbers, and it’s weighted differently for Mobile and Desktop. The numbers I gave you are for Mobile, but you can check the tool for the most up-to-date info.

In the lab test metrics section, you’ll see some different numbers. You’ll find LCP and CLS here, but you won’t see the FID or INP metrics like you do in Core Web Vitals (CWV). That’s because FID and INP need people to click on the webpage, and lab testing can’t do that. Instead, you can look at Total Blocking Time (TBT) as a similar number to help you make things better.

If you want more information, just click the “Expand view” button. It’ll give you a bigger view with explanations for the numbers and links to learn more.

The final part gives you some info about where all this data comes from.

If you move your mouse over this, you’ll get even more details about the test. PageSpeed Insights used to use a Moto G4 phone for testing, but now it’s using a Moto G Power. You can also see where the test was done, like in North America, Europe, or Asia.

We have some pictures that show how a webpage loaded step by step.

If you click “View Treemap,” you can see which files on the page are the biggest and how much of the code is not being used.

When you first look, you’ll see problems related to all the numbers we talked about. But there are buttons that let you focus on problems with just one specific number if you want to make it better.

The “Opportunities” and “Diagnostics” parts will point out things that can make your webpage work better.


The numbers they show you about how much better your webpage can get might not be totally accurate. There could be other things stopping you from seeing those improvements, or you might not see any improvement at all even if you fix something. Sometimes, you have to fix a bunch of things to actually make a difference.
You can click to see more details about each problem. They’ll also give you advice on how to fix each issue. The tips can change depending on the system you’re testing. For example, if you test a page on a WordPress website, you’ll get advice specific to WordPress.

The tips can help explain some of the issues in simpler words. For example, when it says “defer offscreen elements,” it means you should load images only when you need them. If you’re using WordPress, you can search for a plugin that does this.
There’s more info that tells you what the biggest image is for Largest Contentful Paint (LCP), what’s causing stuff to move around on the page (Cumulative Layout Shift or CLS), and what’s slowing down the main part of the webpage (this is important for First Input Delay or INP). This info can help you figure out what to fix first.


There’s a part that tells you what you’re already doing well, called “passed audits.” You might still make these things better, but it’s probably smarter to focus on fixing other problems first.

PageSpeed Insights has a powerful tool called API. It lets you get a bunch of data about your website’s performance from different sources. You can collect real user data, lab test data, and even some special Core Web Vitals data that you can only get here.
The challenge is that not everyone knows how to gather and store all this data in bulk. But if you use Ahrefs’ Site Audit, we’ve made it simple for you. Just follow the steps in the Crawl settings to set up Core Web Vitals, and you’re good to go.

When you start a website check, we’ll grab all the important data from PageSpeed Insights and put it into the Performance report. This way, you can take a closer look at the pages that might have issues.

We don’t just stop there. We keep a record of the data from past website checks so you can track how well your site is doing over time. Plus, you can see how many pages are affected by each specific problem.

For checking and keeping an eye on things, I recommend using Ahrefs like we talked about earlier. It helps you spot pages with problems and track how things are going over time. You can also use the Core Web Vitals report in Google Search Console (GSC).
The cool thing about GSC is that it groups similar website addresses together. So, if you have a bunch of pages that are similar because they use the same design or layout, fixing one problem can actually fix it for all those pages at once. It saves you time!

Once you figure out which pages or templates need fixing, you can follow the advice from PageSpeed Insights to make them better. Also, take a look at our guides on how to fix different problems related to LCP, FID, and CLS.
To see if your improvements worked, you can use PageSpeed Insights again or do another website check with Site Audit to gather a lot of data at once. Remember, Core Web Vitals data can take a bit longer to show changes because it’s an average over 28 days. So, use PageSpeed Insights or the data in Ahrefs to see if your changes improved the lab test numbers.
Trackbacks/Pingbacks